Bytronic ByCockpit provides live information on production processes
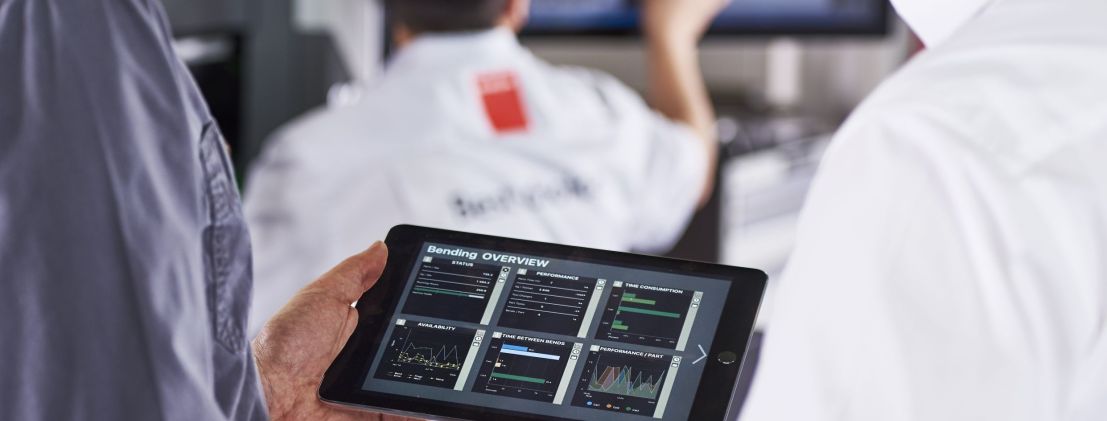
With the Bytronic ByCockpit, Bystronic has developed a new app that analyzes and visualizes the process data associated with sheet metal production. This makes the quality, times, and cost of production transparent and optimizable.
The ByCockpit provides real-time information on sheet metal production processes. Bystronic’s new app visualizes selected key indicators regarding machine performance and manufacturing efficiency. During the development of the ByCockpit, Bystronic’s IT specialists took a close look around a number of sheet metal processing companies. Their guiding question was: How do users retrieve information from their machines, in order to analyze and improve their production processes?
The result: For many sheet metal processing companies, the process of retrieving data from their machine systems and subsequently translating it into usable information is very tedious. What is more, they must deal with price pressure, short delivery deadlines, and increasing quality demands. All this means that sheet metal processing companies nowadays are forced to respond quickly and to constantly improve their production. The ByCockpit helps reveal deficiencies in the production processes.
ByCockpit runs everywhere
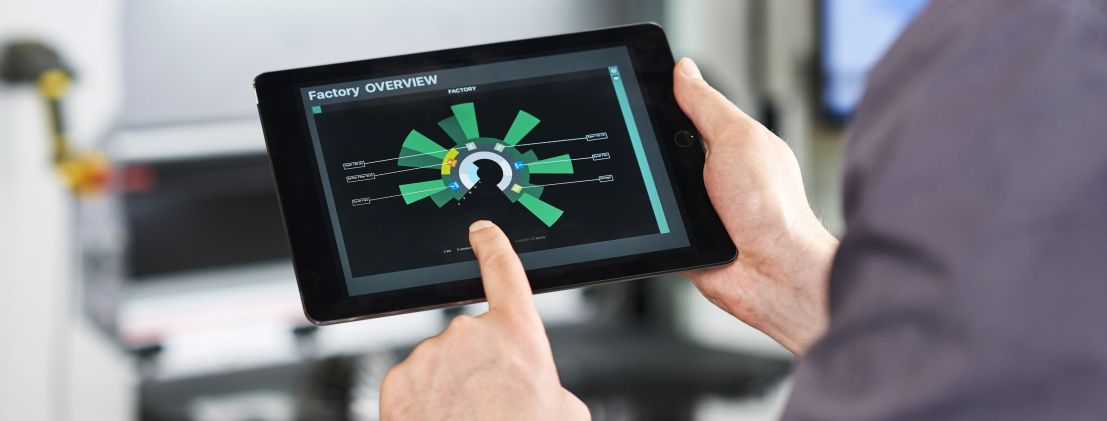
Be it on laptops, smartphones, or tablet computers. The ByCockpit runs on virtually all mobile devices. Just like any other app, the ByCockpit is simply installed on the designated devices. Subsequently, all the required Bystronic machine systems (with an OPC UA interface) can be registered.
When the ByCockpit is launched, a selection of approximately 30 widgets is available. Users can switch between pre-defined overviews and the favorites view. In the favorites mode, users can individually configure their ByCockpit. Using the drag and drop principle, they select the widgets that provide the required overview of their individual machine systems.
The most important widgets
One of the ByCockpit’s numerous widgets is the Sunburst view. It is a circle diagram that displays the condition of the entire production at a glance. Green bars denote machines that are currently in operation. Red bars show machines that are idle. And blue bars combine all the systems that are connected to form an assembly line.
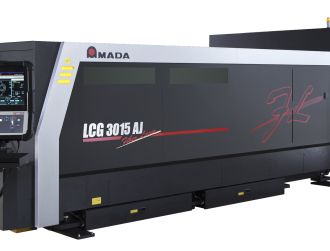
With a click, users can switch to the overview for the laser cutting process step. Here, the status widget displays the output (kilowatts) with which the laser is cutting, the total operating hours of the system, and whether the next service should be scheduled.
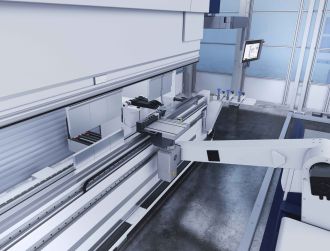
Another widget in the laser cutting overview displays the overall equipment effectiveness (OEE). This parameter results from the factors of machine availability, parts output, and the quality of the cut parts. In addition, the OEE widget allows a direct comparison to be drawn to previous production cycles. The next click leads to the overview of bending jobs. Here, the performance widget provides information about the number of bent parts produced, the time required to produce them, and the number of tool changes. This overview allows the bending set-up times to be optimized.
The parts performance widget determines the development of the bending time for parts over time. A diagram provides a daily overview and thus reveals deviations in the production processes. It also enables a comparison to be made between manual and automated bending.
The widgets in the storage overview provide detailed information about the materials on stock. Here, users can find out what raw materials are in the warehouse and in what quantities. The overview lists all the materials with weight and purchase value. In addition, it enables direct comparisons to the inventory at earlier points in time.
